eco+ Thermostat Optimization Pilot
Prepared for ecobee by Demand Side Analytics, LLC (November 2020)

Executive summary
eco+ is a thermostat optimization platform developed by ecobee to improve the energy performance of residential HVAC systems with minimal effort. The platform prompts customers to indicate their desired balance of comfort versus savings. Then, eco+ tailors an algorithm unique to the customer for the optimization that best represents their comfort preferences and the thermal profile of their home.
The platform consists of three categories of algorithms.
Presented to users as Community Energy Savings (CES), this feature shifts cooling loads away from peak hours when the electrical grid is most constrained through customized pre-cooling of the home and temporary temperature setbacks during system peak hours.
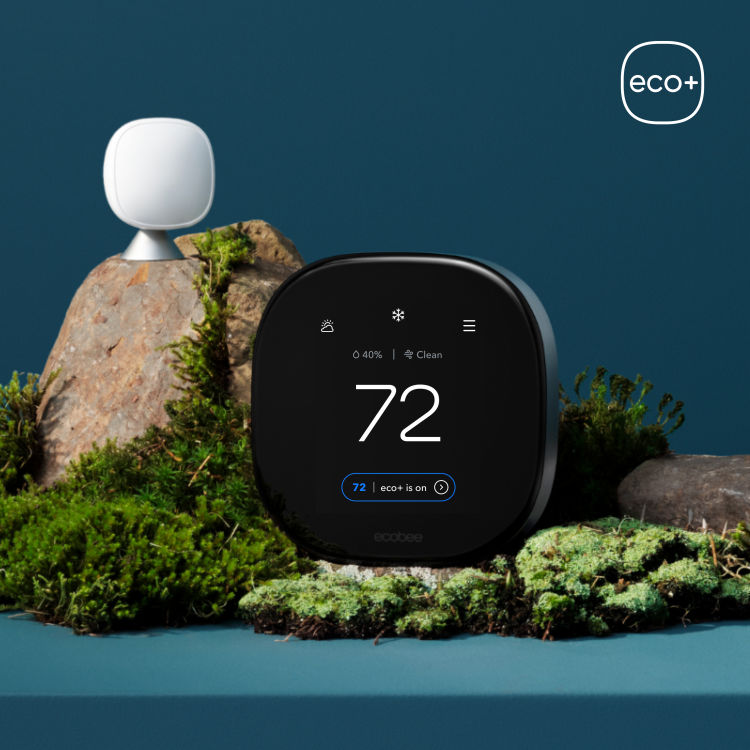


Figure 1 shows several enrollment screens where eco+ participants can configure their comfort settings, turn on or off certain features, select their TOU rate, and enroll in their utility’s demand response program.
Figure 1: Sample eco+ Configuration Screens

During summer 2019, the eco+ platform was deployed across North America to a large pilot group of ecobee thermostats to demonstrate the capabilities of the platform. The pilot included a population of approximately 240,000 ecobee thermostats using a Randomized Encouragement Design (RED). The RED is similar to a randomized controlled trial (RCT) which is often used with behavioral conservation programs like Home Energy Reports, except that the RED includes an opt‐in component. Devices were stratified by climate zone then randomly assigned to either an experimental group or a control group. The experimental group was invited to participate in the eco+ pilot and the control group was not.
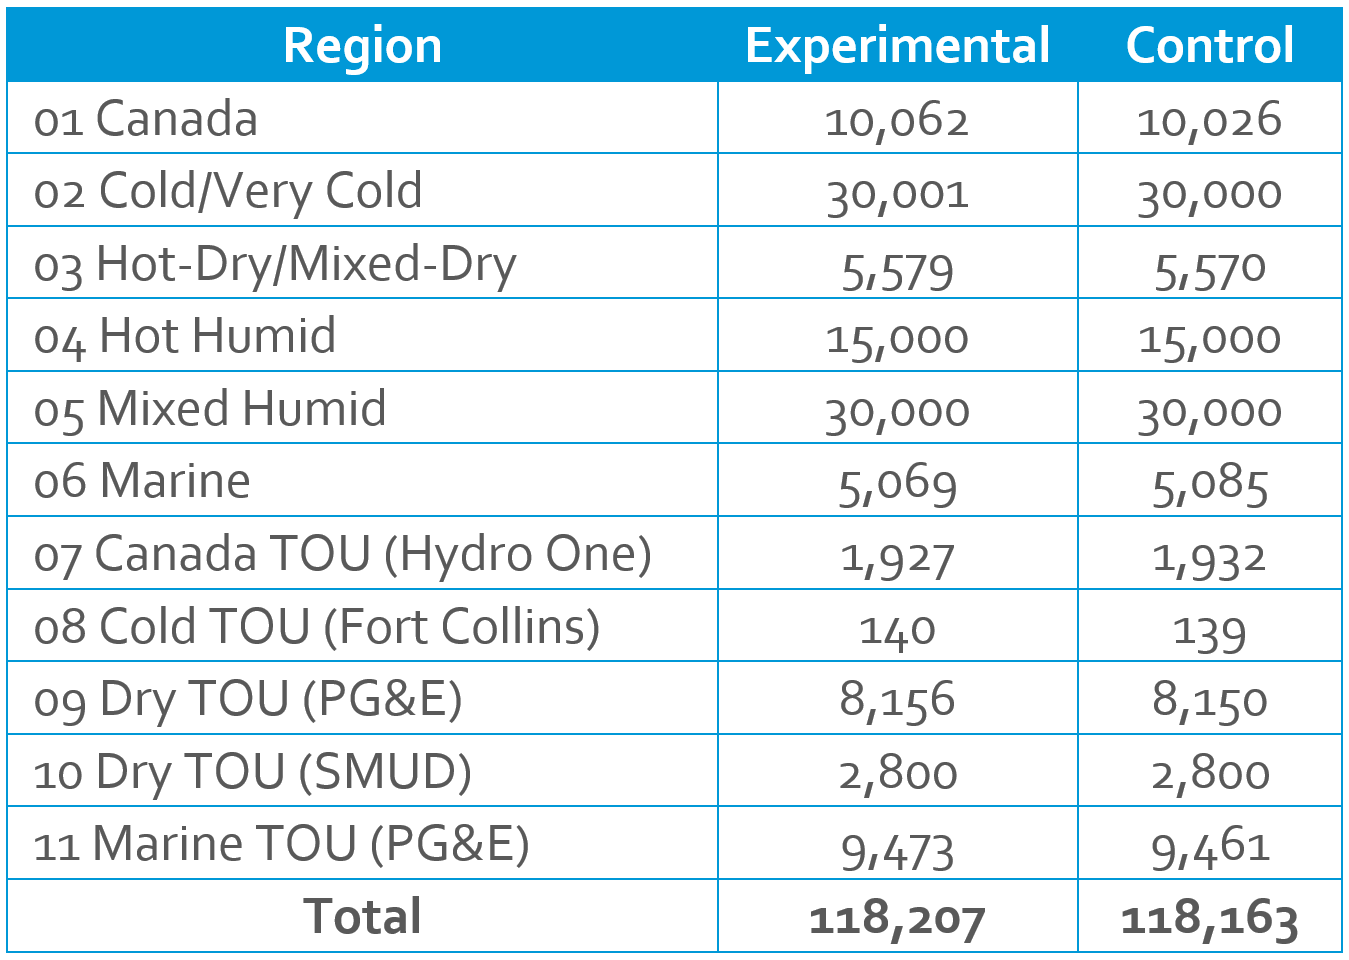
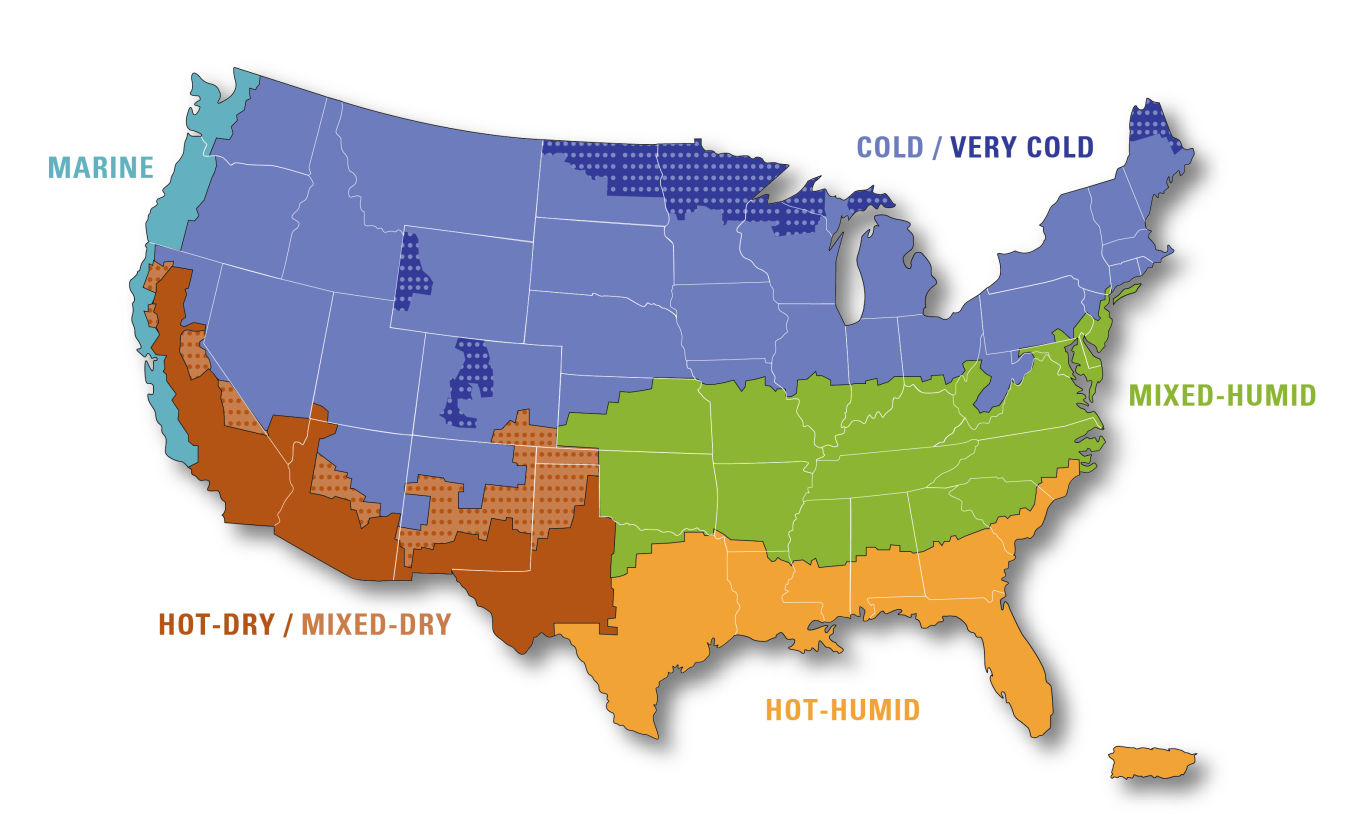
The experimental group was not paid an incentive to enroll in eco+ or to participate in DR events. Table 1 shows the count of thermostats across the 11 regions and three experimental cells. Region 1 is Canada. Regions 2 through 6 correspond to five US Department of Energy Building America Climate Zones overlaid on a map in Figure 2. Regions 7 through 11 are specific electric utility service territories with high prevalence of time-varying pricing. These utility service territories were intentionally over-sampled in an effort to bolster the sample size for the eco+ TOU optimization algorithm analysis.
Table 1: Thermostat Count by Region and Experimental Cell
The deployment of eco+ to users was no different in Regions 7-11 than in Regions 1-6. All recipients were given the option to select a time-varying electric tariff and enable the TOU optimization feature. In fact, over five thousand devices in Regions 1-6 did enable the TOU feature over the course of the pilot. Similarly, devices in Regions 7-11 could enable energy efficiency and demand response features just like their counterparts in Regions 1-6.
Figure 2: United States Climate Zone Map
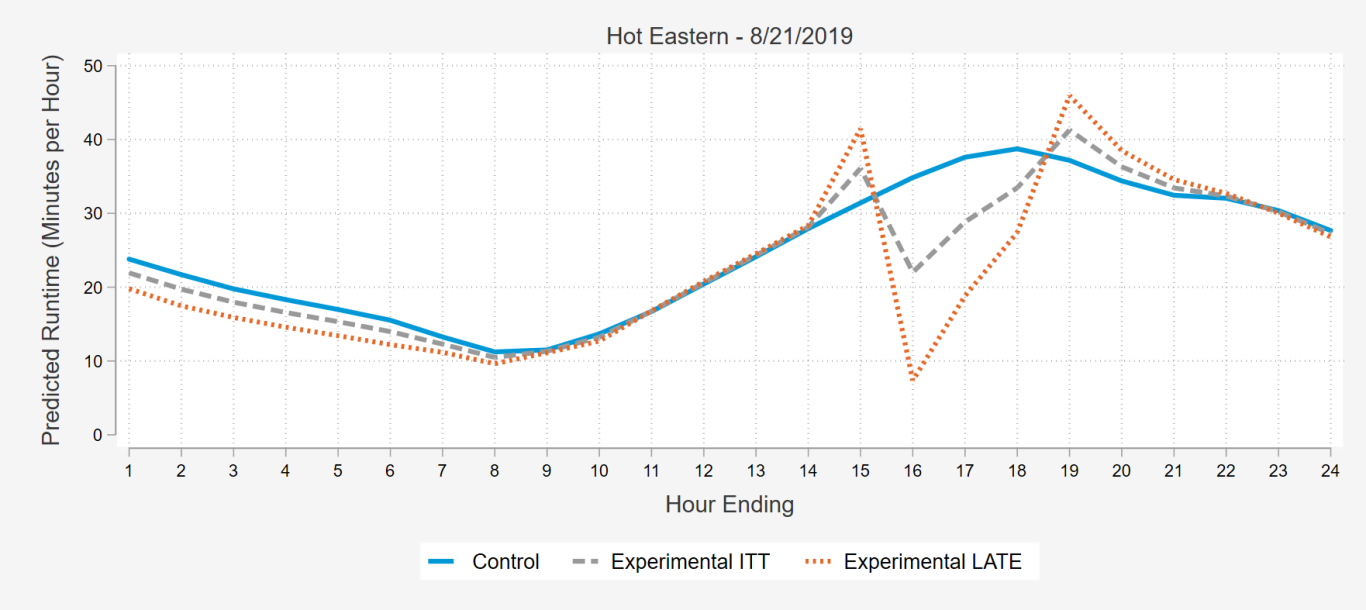
The RED provides a robust experimental design against which to measure the impacts of the eco+ platform because the control group experiences all of the same weather and other external factors as the experimental group. Comparing the HVAC runtime characteristics of the experimental group to the control group after the rollout of eco+ produces estimates of the impact of the eco+ offer. Some users in the experimental group accept the offer and some do not, so this set of results is referred to as the Intention to Treat (ITT) impacts. The ITT impacts can then be divided by the percentage of devices in the experimental group that accepted the eco+ offer to determine the Local Average Treatment Effect (LATE). The LATE impacts are the estimated per-device impacts for users who take advantage of the eco+ platform.
ecobee contracted Demand Side Analytics (DSA) to analyze the impacts of the eco+ pilot and provide its product and data science teams with insights into the typical measurement and verification (M&V) practices used to determine energy and peak demand impacts for this type of offering.
1.1 Demand Response:1.1.1 2019 Results
Figure 3 illustrates the DR algorithm on a sample event day called from 3pm to 6pm. The blue line indicates the control group’s average cooling runtime and the dashed gray line shows the runtime for the experimental group. Orange bars show the difference between these curves, which are the basis for the ITT impacts. The green line shows the average pre-cooling time for the experimental group and the purple dashed line shows the average DR setback time during the event.
Figure 3: Example 2019 DR Event

Runtime impacts were modeled using a difference-in-differences regression analysis and scaled by the percent treated to estimate LATE impacts, or the average impact among devices who received the DR algorithm. Approximately 45% of the experimental group received the eco+ DR algorithm on this event day, so the LATE impacts are roughly 2.2 times the ITT impacts. Figure 4 shows the modeled impacts on the example event day on both an ITT and LATE basis.
Figure 4: 2019 Modeled Runtime Impacts
There was a total of 55 demand response events in the summer 2019 analysis. Impacts are reported separately for each region and time zone by hour of event. Demand response events ranged from two to four hours in length and were called at various times on hot weekday afternoons. Event days were chosen based on market research of existing DR programs and temperature triggers were used to select the days on which to dispatch DR. As is evident in the reported results, impacts vary by region, time zone, date, and event hour. In order to provide one single value for per thermostat savings, we perform a series of weighted averages that take into account the participation rates, connected load assumptions, and number of events with different durations.1 Ultimately, we estimate average DR savings of 0.91 kW per opt-in thermostat across all event hours. For the EE/DR regions in the RED population during summer 2019, this translates to approximately 25 MW of peak demand reduction capability if all regions were dispatched on the same day.
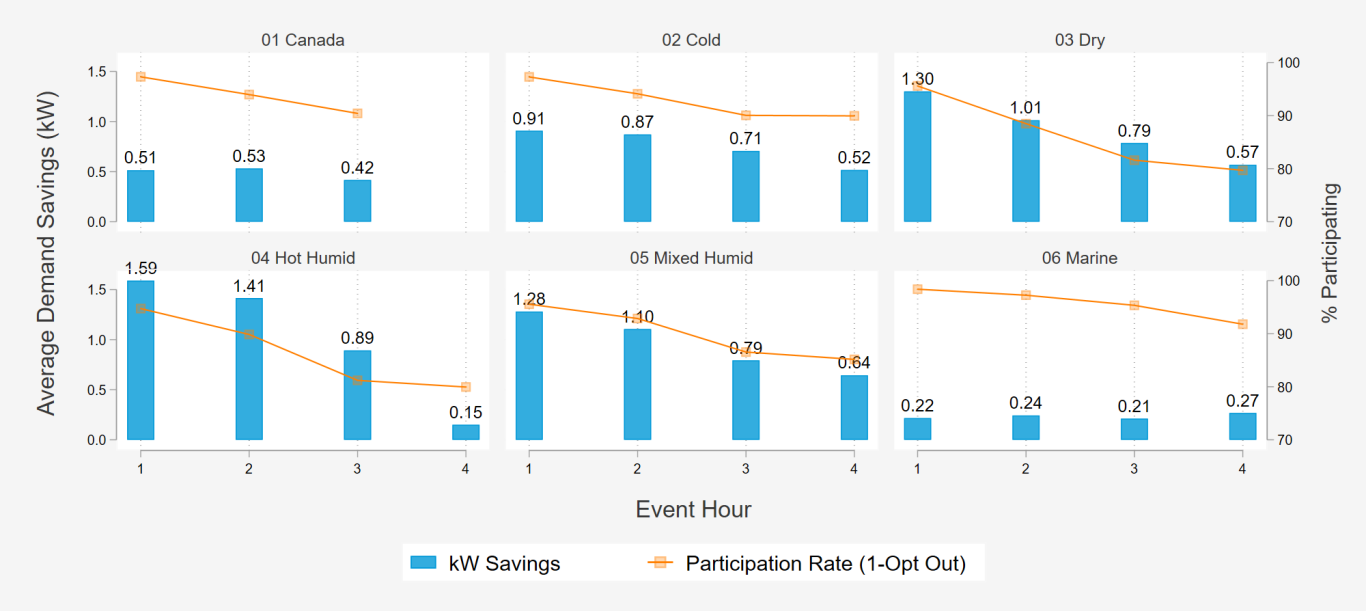
Figure 5 shows the average impacts by event hour and region and the participation rate over the course of events. All summer 2019 events have an Hour 1 and Hour 2, so average impacts from these hours are weighted more heavily in the average hourly demand savings of 0.91 kW. Fewer events are three or four hours long, leading to less weight in the overall savings estimate. In aggregate, summer 2019 impacts were largest during the first event hour and diminished in subsequent hours. More granular inspection shows that this trend is less pronounced in regions with lower average cooling usage. This downward trend is typical of thermostat DR programs that use a setback strategy.2
Figure 5: 2019 Demand Savings and Participation Rates by Event Hour
1.1.2 2020 Results
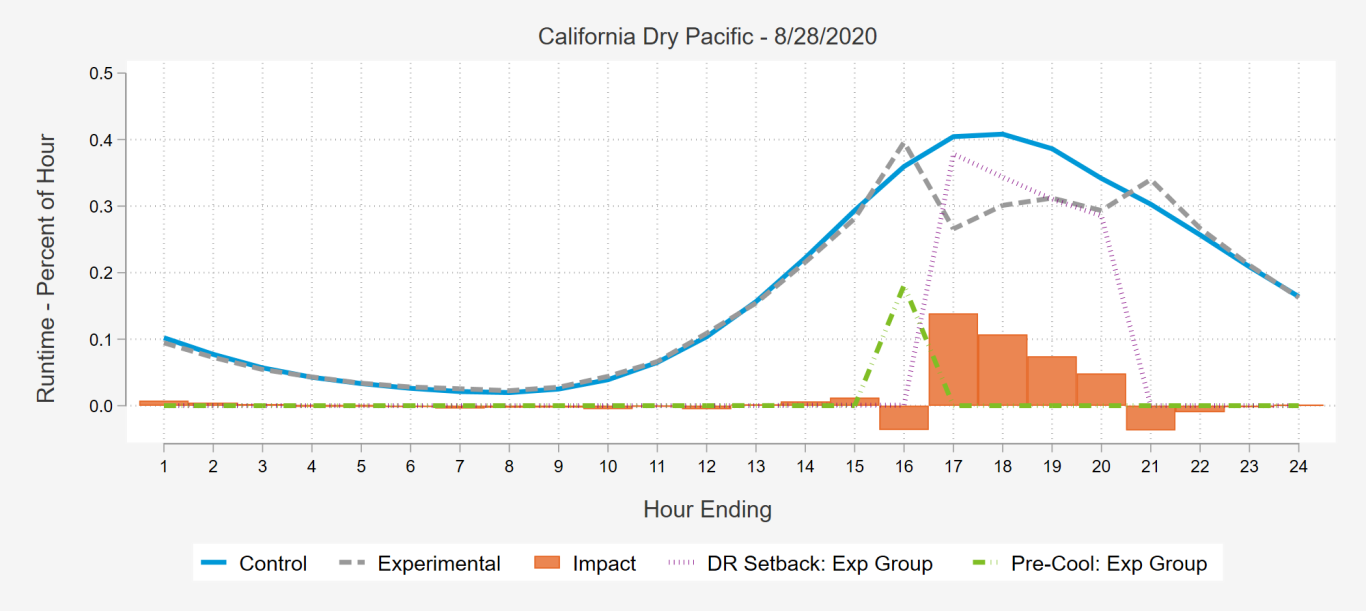
The 2020 evaluation followed the same methodology as in 2019. Figure 6 illustrates the DR algorithm on a sample 2020 event day called from 4pm to 8pm. The blue line indicates the control group’s average cooling runtime and the dashed gray line shows the runtime for the experimental group. Orange bars show the difference between these curves, which are the basis for the ITT impacts. The green line shows the average pre-cooling time for the experimental group. And the purple dashed line shows the average DR setback time during the event.
Figure 6: Example 2020 DR Event
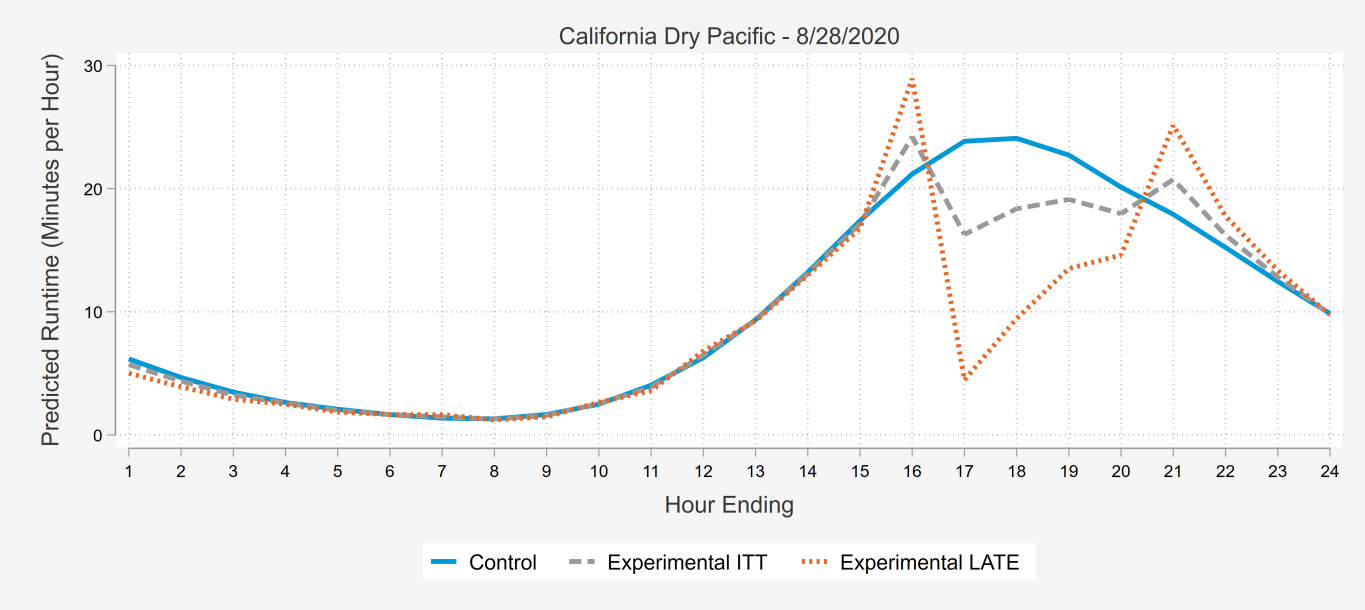
Runtime impacts were modeled using a difference-in-differences regression analysis and scaled by the percent treated to estimate LATE impacts, or the average impact among devices who received the DR algorithm. Approximately 39% of the experimental group received the eco+ DR algorithm on this event day, so the LATE impacts are roughly 2.5 times the ITT impacts. The highest observed share of the experimental group that received DR during summer 2020 was 53%, when all devices in the eastern time zone of the Mixed Humid region were targeted. Figure 7 shows the modeled impacts on the example event day on both an ITT and LATE basis.
Figure 7: 2020 Modeled Runtime Impacts
There were 28 demand response events in the summer 2020 analysis. Impacts are reported separately for each region and time zone by hour of event. Demand response events ranged from three to four hours in length and were called either at 2pm or 4pm local time. Event days were chosen based on market research of existing DR programs and temperature triggers were used to select the days on which to dispatch DR. As is evident in the reported results, impacts vary by region, time zone, date, and event hour. In order to provide one single value for per thermostat savings, we perform a series of weighted averages that take into account the participation rates, connected load assumptions, and number of events with different durations.3 Ultimately, we estimate average DR savings of 1.12 kW per opt-in thermostat across all event hours. For the EE/DR regions in the RED population during summer 2020, this translates to approximately 29 MW of peak demand reduction capability if all regions were dispatched on the same day.
Figure 8 shows the average impacts by event hour and region and the participation rate over the course of events. Standard summer 2020 events are three hours in duration. Two non-standard region events are presented in the results, but do not factor into the average event calculations. Average impacts from the standard, three-hour events are weighted equally in the average hourly demand savings of 1.12 kW. In aggregate, summer 2020 impacts were largest during the first event hour and diminished in subsequent hours. This downward trend is typical of thermostat DR programs that use a setback strategy.
Figure 8: 2020 Demand Savings and Participation Rates by Event Hour

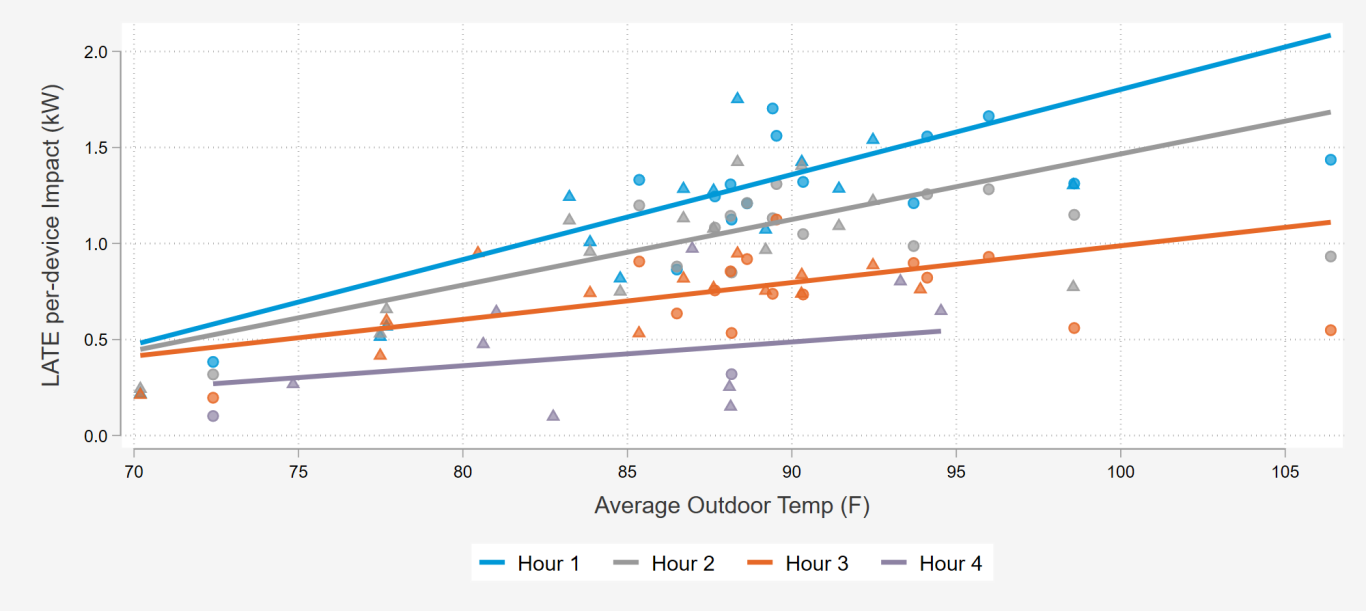
Figure 9 summarizes the LATE results of from all demand response events called during summer 2019 and summer 2020. In general, the per-device load reductions increase with outdoor temperature. At any given temperature condition, load reductions are highest during the first hour of a demand response event and decrease in each subsequent hour.
Figure 9: Per-Device Load Reduction Versus Outdoor Temperature by Event Hour
1.2 Time of Use.:1.2.1 2019 Results
The Time of Use algorithm simplifies TOU rates for customers by providing a hassle-free way for customers to automatically respond to price signals through customized pre-cooling and temporary temperature setbacks of the home. The TOU eco+ analysis faced complications due to attrition from those randomized into the experimental group to those receiving treatment. The attrition is likely the result of a number of factors, including low enrollment in TOU rates in target regions. As a result, the RED was modified and TOU participants across all experimental cells were included in the analysis. We analyzed four separate rates from five climate zones using a matched control group to serve as the counterfactual for the difference in differences regression. Results by rate are displayed in Table 2.
Table 2: TOU High Level Results - Summer 2019

Figure 10 illustrates the eco+ TOU algorithm’s hourly impacts on cooling energy expenditures for the SMUD Residential Time of Day (TOD) rate on an average weekday. The impacts are greatest during the first hour of the 5pm-8pm peak period when setback occurs and during the hour immediately following the peak period when cooling use increased at the off-peak rate.
Figure 10: Hourly Weekday Bill Impacts for SMUD TOD Rate
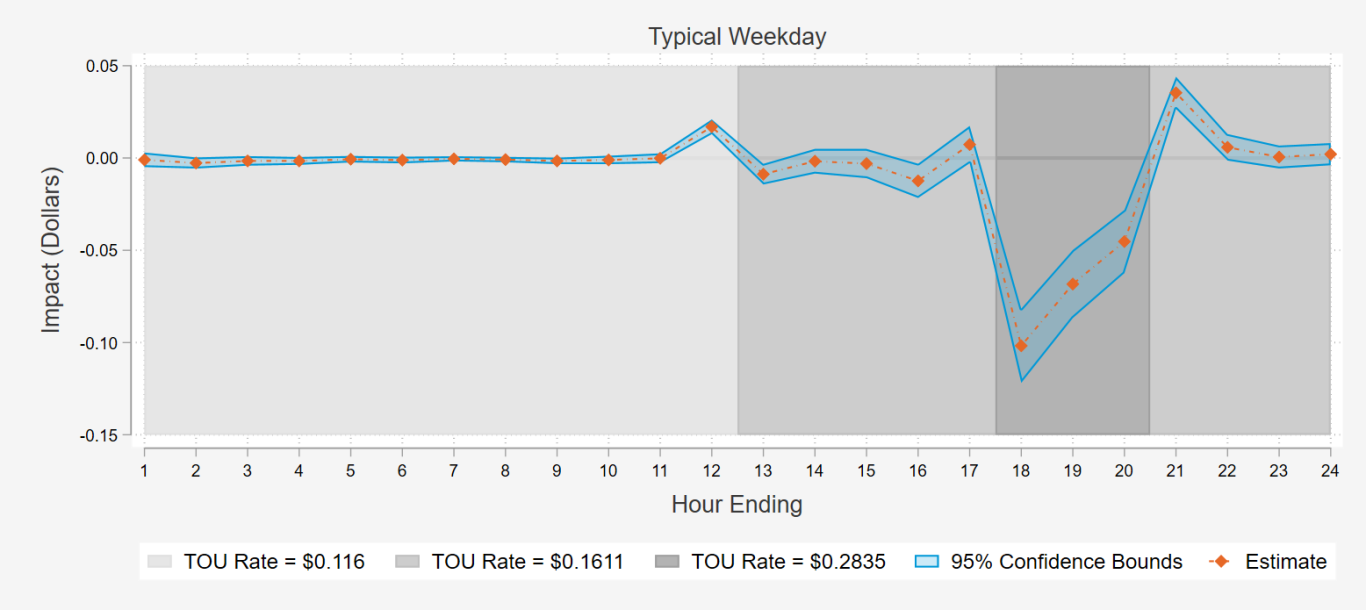
In general, bill savings associated with the eco+ TOU treatment are larger when participants have higher reference runtimes to reduce, higher connected load assumptions, and more expensive peak electricity prices. Even though the percentage of on-peak savings is highest in Canada, the magnitude of savings is low compared to the other regions due to the cheaper energy prices and limited air conditioning usage. Another factor affecting the average on-peak percent savings is the duration of the peak. Shorter peak hours yielded larger average demand impacts (kW) but less overall energy savings (kWh). The savings on monthly energy expenditures factor in the duration of the peak, as well as the price differential from peak to off-peak rates. The largest energy expenditure savings were found on the PG&E rate in part because this rate had TOU pricing on weekends. The PG&E rate was also substantially higher than in other rates. In fact, the PG&E off-peak rate is higher than the Hydro One on-peak rate if the CAD to USD exchange rate is considered. Results indicate that the eco+ TOU algorithm achieves bill savings through shifting load away from high priced periods, and TOU customers also see savings through a decrease in overall cooling energy use.
1.2.2 2020 Results
For the summer 2020 season, DSA retained one of the rates from the previous summer, SMUD Residential TOD, and selected three new rates for analysis. These new rates provided additional variation in region and rate structure. The 2020 TOU analysis used the same methodology as the previous summer. Table 3 presents the results of the 2020 TOU analysis by rate.
Table 3: TOU High Level Results - Summer 2020
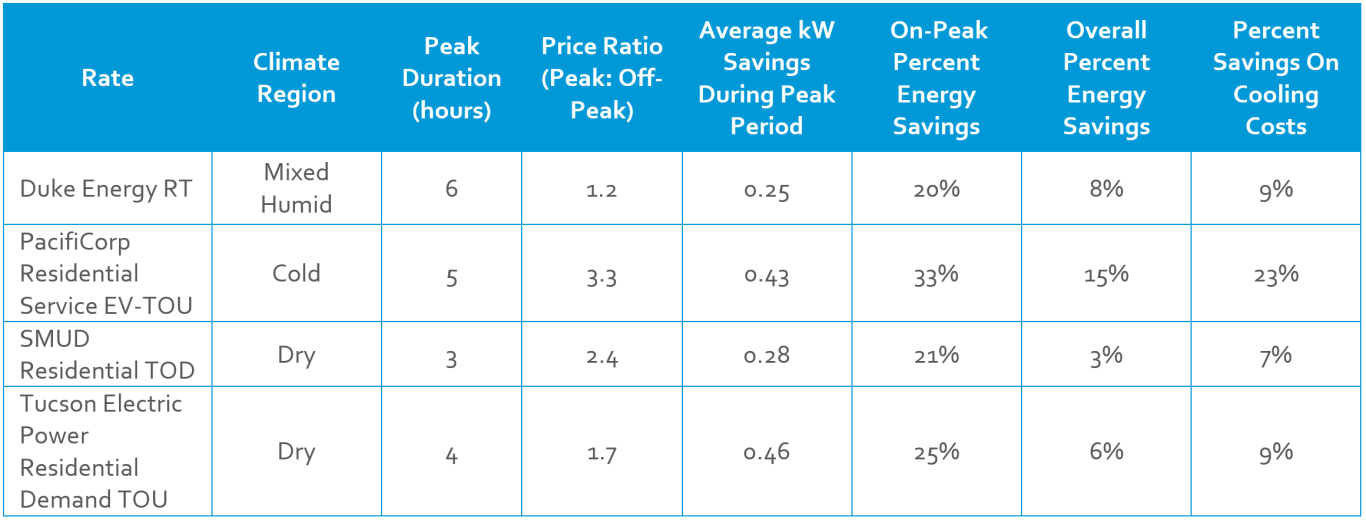
Generally, the results followed the same patterns that were identified in the previous summer. All rates experienced the greatest impacts in the first hour of the peak period. The TOU feature also created larger impacts in locations with larger cooling loads to reduce. Tucson Electric Power had the highest on-peak average demand savings across all analyzed rates due to Arizona’s extreme summer weather and large cooling loads.
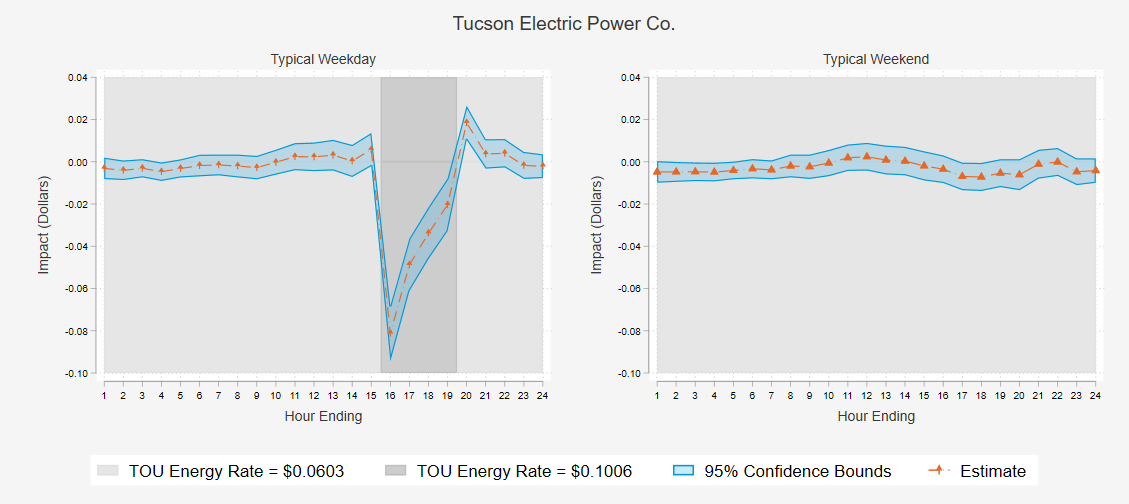
The new rates also provided some additional insights into the impact of the eco+ TOU feature on different pricing structures. Two of the new rates included demand charges, where customers incur an additional charge based on their peak demand within a certain time period. Since the eco+ analysis uses HVAC runtime data rather than whole home data, DSA cannot identify the peak demand hour and calculate the effect of the TOU algorithm on this billing determinant. For these rates, the percent bill impacts only apply to the energy portion of the bill, and do not take into account demand charge portion of the bill. Figure 11 shows the average cooling energy expenditure impacts of the TOU feature on Tucson Electric Power’s Residential Demand TOU rate. The Tucson Electric Power rate is a coincident peak demand rate, meaning the peak demand level is set during the rate’s 3-7pm peak period. On average, the eco+ TOU feature reduces air conditioning runtime during each hour that could set a customer’s demand charge. There is no TOU pricing on weekends so the eco+ TOU feature is inactive. The modeled savings reflect this with estimates centered at zero for all hours.
Figure 11: Tucson Electric Residential Demand TOU - Energy Expenditure Impacts
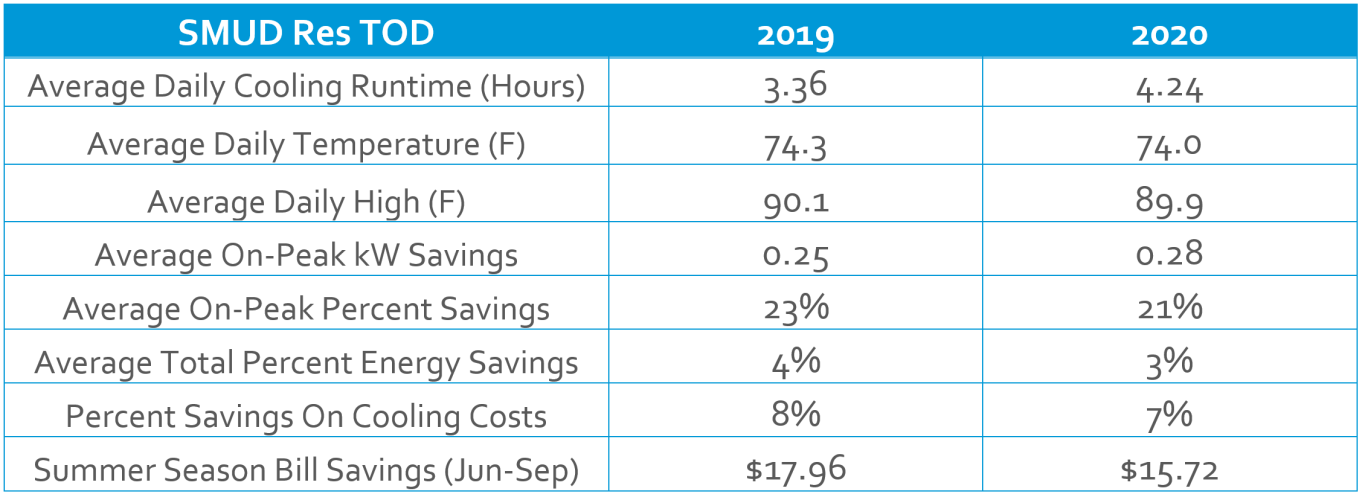
SMUD’s Residential TOD rate was the only rate analyzed in both 2019 and 2020. The number of customers on this rate more than tripled in the second summer of the analysis,4 providing a larger sample for estimation. Table 4 provides a comparison of the TOU feature’s performance on this rate between both summers. Overall, energy and bill savings were fairly consistent for this rate between the two summers. The primary difference is that baseline cooling runtime was higher in 2020. There are several factors that could have contributed to the difference in base runtime, such as the difference in analysis time periods. The 2019 TOU analysis was conducted using August and September data, later in the summer, while the 2020 analysis used data from June to August. The COVID-19 pandemic is a likely contributor to higher baseline cooling loads this summer. Since more people are staying home during the day than normal due to work from home orders, households are placing greater demands on their HVAC systems to keep their homes comfortable throughout the day.
Table 4: SMUD Analysis Comparison 2019 and 2020
1.3 Energy Efficiency:1.3.1 2019 Results
The energy efficiency components of eco+ include adjusting the temperature for humidity, Schedule Assistant and Enhanced Smart Away. Figure 12 shows the daily average percent savings per opt-in thermostat across all regions. The weighted average energy savings per opt-in thermostat was approximately 6% over the 2019 post period after netting out the difference in runtime observed during the pre-period.
Figure 12: Aggregate Daily LATE Percent Energy Savings

Table 5 shows the LATE energy efficiency results, by region and month, along with the margin of error at the 95% confidence level. Energy efficiency savings were statistically significant for each of the six climate regions analyzed when August and September are pooled.
Table 5: Summer 2019 LATE Energy and Demand Savings with Margin of Error at 95% Confidence Level

1.3.2 2020 Results
Figure 13 shows the average daily percent savings per opt-in thermostat across all regions.5 The weighted average energy savings per opt-in thermostat in summer 2020 was approximately 5% over the three-month period after netting out the difference in runtime observed during the pre-period.
Figure 13: Aggregate Daily LATE Percent Energy Savings

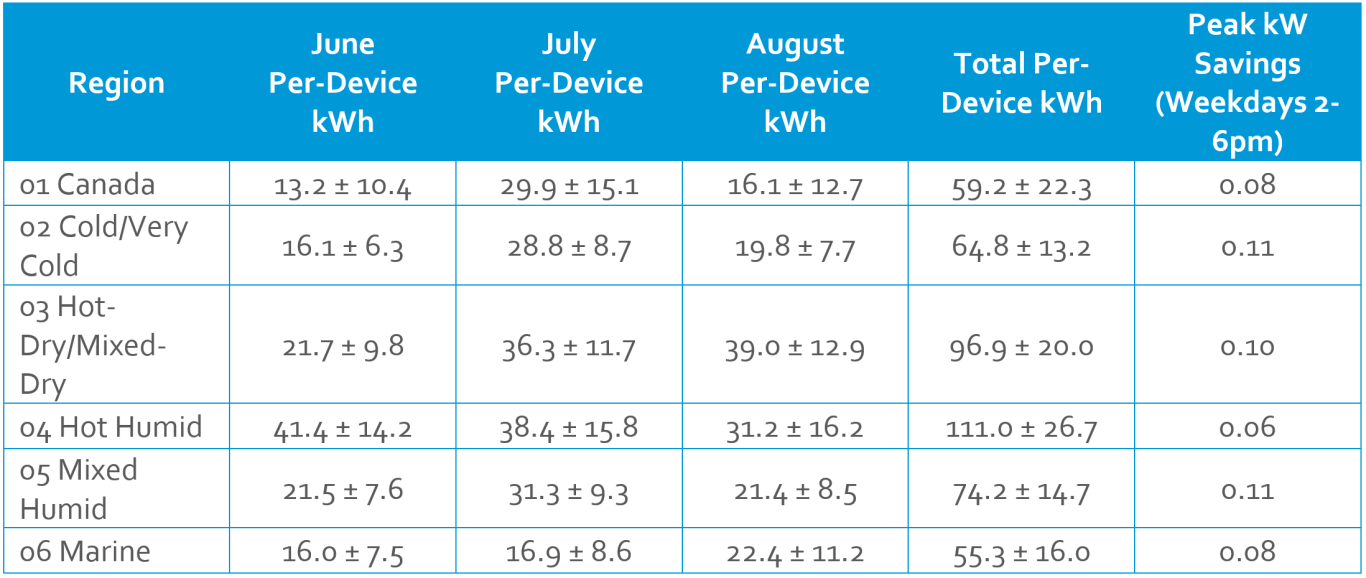
Table 6 shows the LATE energy efficiency results, by region and month, along with the margin of error at the 95% confidence level. Energy efficiency savings were statistically significant for each of the six climate regions analyzed.
Table 6: Summer 2020 LATE Energy and Demand Savings with Margin of Error at 95% Confidence Level
1 Connected Load Assumptions are included in an Appendix of the full report and based on Technical Reference Manuals, evaluation reports, and other third-party research.
2 There was only one four-hour event in the Hot Humid region. It was called in the Central time zone on a day when thunderstorms moved across east Texas and lowered outdoor temperatures by approximately 20 degrees (F). The drop in kW impact observed in hour 4 of the Hot Humid region Figure 3 is a function of a single, somewhat atypical, event hour.
3 Connected Load Assumptions are included in an Appendix of the full report and based on Technical Reference Manuals, evaluation reports, and other third-party research.
4 SMUD conducted a marketing campaign in June 2020 to encourage its ecobee customers to enable the TOU feature.
5 Note TOU cells were included in the analysis for EE.